
MiniMax M3.1 Flash scored 43 on Artificial Analysis’s Intelligence Index in October 2026. The independent score placed it fifth among 173 models in its comparison class. MiniMax separately reports 73.7% on DeepSWE v1.1, a software-engineering benchmark. Artificial Analysis’s model profile and MiniMax’s launch announcement measure different things, so neither score alone answers whether the model is reliable for every workload.
At a glance
- MiniMax reports 73.7% on DeepSWE v1.1, which tests long software-engineering tasks. MiniMax describes the result.
- Artificial Analysis gives M3.1 Flash an Intelligence Index score of 43 and a measured output rate of 112.8 tokens per second. Artificial Analysis reports both figures.
- The independent index combines 10 evaluations, including AutomationBench-AA, Terminal-Bench 4.0, Humanity’s Last Exam and AA-Omniscience. Artificial Analysis lists the index components.
- MiniMax reports 76.2 on BankerToolBench, 61.7 on OSWorld V2 and 29.6 on Agents’ Last Exam. MiniMax publishes those results.
- Artificial Analysis records a 93% non-hallucination failure pattern under its AA-Omniscience measure. Its model profile separates that measure from accuracy.
What did MiniMax M3.1 Flash actually ship?
MiniMax announced M3.1 Flash on 19 October 2026 through its API, M Plan and MiniMax Code. The company described Space Bunny as an earlier version that had processed more than 200 trillion tokens while operating anonymously. MiniMax’s announcement gives that release account.
The launch post describes M3.1 Flash as a model for agentic tasks, coding, computer use and cybersecurity. In plain terms, it is aimed at systems that complete several connected actions rather than only answer a single prompt. MiniMax also says model weights would be released later. The company’s release post states those availability details.
The later model card describes text and image input with text output. It lists a context window of up to 1 million tokens. Tokens are the small pieces of text that a model reads and generates. The Hugging Face model card documents the modalities and context window.
The model card describes M3.1 Flash as a mixture-of-experts, or MoE, model. In an MoE system, only selected parts of the model process each token. The card declares 220.5 billion parameters for the published weights, while other hosted-model descriptions cite 428 billion total parameters and 23 billion active parameters. Hugging Face provides the published-weight figure and Together AI lists the hosted-model architecture figures.
That difference matters when readers compare model sizes. “Active parameters” describes the amount selected for a token, not the total weight files that a deployment must store. A model can therefore perform fewer calculations per token while still requiring substantial storage.
What was promised versus what was measured?
The launch material mixes product claims with benchmark results. MiniMax says online inference is nearly three times faster than its predecessor and that agent usage costs are 70% lower. Those are company comparisons, not independent measurements with a published matched protocol. MiniMax makes both claims in its announcement.
The company reports 200 or more output tokens per second in everyday use, with median speeds above 170 tokens per second. Artificial Analysis measured 112.8 output tokens per second on its own provider benchmark. The figures are not interchangeable because the sources use different test conditions. MiniMax provides its speed claims, while Artificial Analysis provides its measured rate.
MiniMax reports three scores that cover distinct kinds of work. BankerToolBench tests multi-step financial workflows and chained tool calls, DeepSWE v1.1 tests software tasks, and OSWorld V2 tests computer operation across applications. The scores therefore describe task families, not a single general ability scale. MiniMax defines the areas covered by those evaluations.
The company also reports 82% on CyberGym. MiniMax says that evaluation focuses on vulnerability discovery and validation. Its announcement adds that internal security experts assessed code auditing, vulnerability patching, penetration testing, malware analysis and reverse engineering, but it does not publish a complete public failure analysis for those internal tests. The launch announcement supplies the CyberGym result and description.
How does M3.1 Flash compare with current rivals?
The most useful independent comparison comes from Artificial Analysis, which evaluates M3.1 Flash and rival models on the same index and component tests. The table separates the benchmark version, test date, setting and score direction. Higher scores are better for every benchmark shown; the index’s cost measure is different and is not included here.
| Independent benchmark | Version | Test date | Setting | Score direction | MiniMax M3.1 Flash | GLM-5.3 Flash | DeepSeek V4.1 Flash-1017 | Gemini 3.8 Flash |
|---|---|---|---|---|---|---|---|---|
| Artificial Analysis Intelligence Index | v4.3.2 | October 2026 | Reasoning model comparison | Higher is better | 43 | 42 | 45 | 41 |
| Humanity’s Last Exam | Not stated | 19 October 2026 | Maximum reasoning effort | Higher is better | 48% | 40% | 43% | 48% |
| CritPt | Not stated | 19 October 2026 | Maximum reasoning effort | Higher is better | 22% | 15% | 24% | 18% |
| AA-Omniscience Accuracy | Not stated | 19 October 2026 | Factual-knowledge evaluation | Higher is better | 56% | 28% | 43% | Not stated |
Sources for the independent comparison: Artificial Analysis’s model profile and Intelligence Index methodology and VentureBeat’s 19 October comparison of the component results. Artificial Analysis lists the index as v4.3.2. The published comparison does not state separate versions for Humanity’s Last Exam, CritPt or AA-Omniscience.
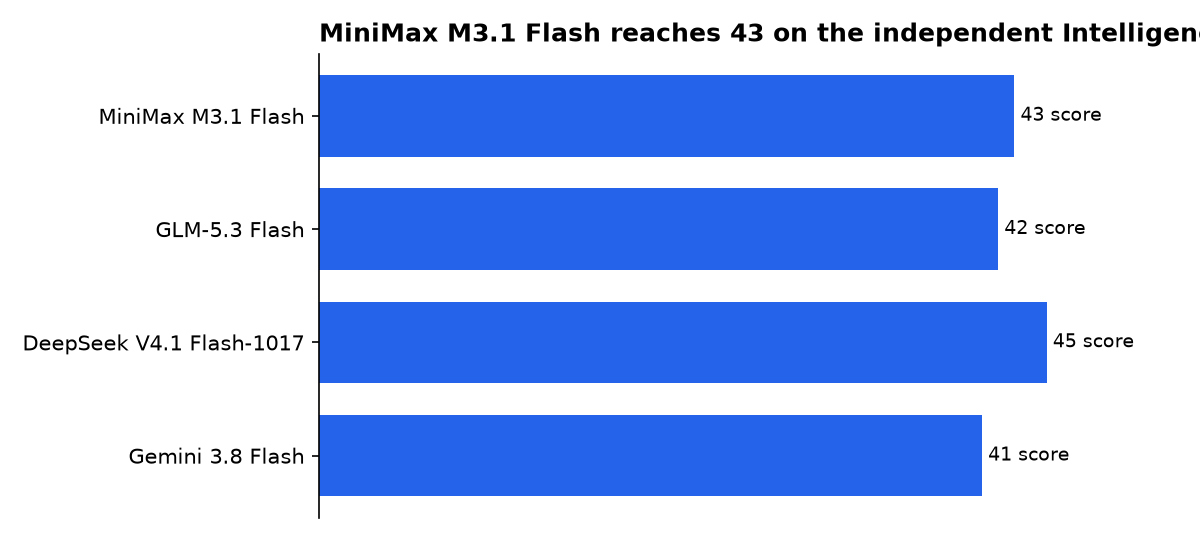
The table shows a close group rather than a runaway leader. DeepSeek V4.1 Flash-1017 scores 45 on the index, two points above M3.1 Flash, while GLM-5.3 Flash scores 42 and Gemini 3.8 Flash scores 41. VentureBeat reports the rival scores.
M3.1 Flash ties Gemini 3.8 Flash at 48% on Humanity’s Last Exam in the comparison cited by VentureBeat. It scores 22% on CritPt, ahead of GLM-5.3 Flash at 15% and Gemini 3.8 Flash at 18%, but behind DeepSeek V4.1 Flash-1017 at 24%. VentureBeat provides those component scores.
These results are useful because they come from an independent evaluator rather than MiniMax’s own launch table. They still do not create a universal ranking. The index combines 10 evaluations, and a model’s position can change when a workload gives more weight to coding, factual knowledge, long context or tool use. Artificial Analysis lists the 10 evaluations and its comparison method.
Artificial Analysis says the index compares models within relevant classes. It compares reasoning models across open-weight and proprietary systems, while price comparisons use a blended input-and-output rate. That makes the result more informative than a single vendor-selected score, but it also means readers should check the individual evaluation that resembles their application. The model profile explains the comparison classes and weighting.
What do the MiniMax benchmark scores prove?
MiniMax M3.1 Flash has evidence of competence across software work, computer use and tool-driven tasks. The company reports 76.2 on BankerToolBench, 73.7% on DeepSWE v1.1 and 61.7 on OSWorld V2. Those numbers are promising for applications that can check intermediate actions or final outputs. MiniMax publishes all three results.
DeepSWE v1.1 is especially relevant to developers because it tests whether a model can understand code, implement changes, fix issues and validate work through testing. MiniMax’s 73.7% result sits close to the rival figures reported in the independent comparison: 74% for Claude Opus 5, 73% for GPT-5.6 Sol and 77% for DeepSeek V4.1 Flash-1017. MiniMax defines the DeepSWE task, while VentureBeat reports the comparison scores.
OSWorld V2 and Agents’ Last Exam test a different problem: operating software and completing professional tasks. MiniMax reports 61.7 on OSWorld V2 and 29.6 on Agents’ Last Exam. MiniMax says M3.1 Flash ranks first among Chinese models on both evaluations, but that is a company-reported comparison rather than an independently reproduced ranking in the launch post. The company provides the scores and its ranking claim.
Benchmark strength is most useful when an application can verify the work. A coding service can run tests. A finance workflow can check fields against a ledger. A tool-using agent can validate whether an API returned the expected state. Those checks reduce the consequences of a plausible but incorrect intermediate step.
The scores do not show that M3.1 Flash can safely make unsupervised factual decisions. Artificial Analysis’s independent tests are important here because they include both broad capability measures and a factual-knowledge evaluation. The split between accuracy and non-hallucination behavior points to a reliability question that the headline scores alone hide. Artificial Analysis lists both AA-Omniscience measures separately.
Is MiniMax M3 better than M2.7?
A direct M3.1 Flash-versus-M2.7 benchmark verdict cannot be verified from the published materials reviewed here. The available independent comparison instead places M3.1 Flash at 43 on the current Artificial Analysis Intelligence Index, while VentureBeat describes the earlier MiniMax M3 at 29. Artificial Analysis provides the current M3.1 score, and VentureBeat reports the earlier M3 comparison.
That is evidence of improvement over M3, not proof against M2.7. The two versions would need the same benchmark release, prompts, reasoning setting and evaluation date for a clean comparison. MiniMax’s launch post does not publish a matched M2.7 score table. The launch announcement contains M3.1 Flash’s results but no such M2.7 table.
The same caution applies to the company’s claim that agent usage costs are 70% lower than its predecessor. It may describe a meaningful product-level reduction, but the post does not provide enough matched workload details to convert that claim into a general benchmark result. MiniMax states the reduction without publishing a full comparison protocol.
Does the 93% hallucination rate mean 93% wrong?
No. The 93% figure does not mean M3.1 Flash produced incorrect answers 93% of the time. It describes the share of non-correct answers classified as hallucinations rather than partial answers or refusals. Artificial Analysis’s model profile identifies AA-Omniscience Non-Hallucination Rate as a separate metric, while VentureBeat explains the reported 93% result.
The companion accuracy result is 56% on AA-Omniscience. That means the reliability warning concerns what happens when the model does not know an answer, not the proportion of all answers that are false. VentureBeat reports the 56% accuracy figure and the metric distinction.
This distinction matters in production. A model that refuses or signals uncertainty gives an application a chance to escalate. A model that supplies a confident but incorrect answer can pass through a superficial quality check, especially when the output is fluent and the workflow lacks a trusted reference.
Artificial Analysis lists AA-Omniscience Accuracy and AA-Omniscience Non-Hallucination Rate as separate measures. The index also includes AA-Briefcase, GDPval-AA, AutomationBench-AA, Terminal-Bench 4.0, SciCode, Humanity’s Last Exam, GDP.pdf, CritPt and AA-LCR v1.1. That structure supports a more careful reading than calling the model simply “good” or “bad.” Artificial Analysis documents the measures and the index composition.
For developers, the practical response is to use retrieval, validation and bounded permissions. Retrieval supplies checked source material. Validation compares the result with a database, test suite or rule engine. Bounded permissions limit what the agent can change until its output passes those checks.
How does M3.1 Flash’s price affect the benchmark result?
Price is not a benchmark score, but it changes the cost of repeating evaluations and running agent workflows. MiniMax lists M3.1 Flash at $0.15 per million input tokens, $0.60 per million output tokens and $0.015 per million cached-input tokens. MiniMax publishes those rates.
The following comparison uses OpenRouter list prices and fixed request profiles. A chat turn uses 1,000 input tokens and 500 output tokens. A retrieval-augmented answer uses 8,000 input tokens and 500 output tokens, while an agent step uses 30,000 input tokens and 2,000 output tokens. OpenRouter provides the listed rates and context limits.
| Model | Chat turns per 1,000 | RAG answers per 1,000 | Agent steps per 1,000 | Context limit |
|---|---|---|---|---|
| MiniMax M2.5 | $0.90 | $3.00 | $11.40 | 204,800 tokens |
| MiniMax M3.1 Flash | $0.45 | $1.50 | $5.70 | 1,048,576 tokens |
| ByteDance Seed 1.6 Flash | $0.23 | $0.75 | $2.85 | 262,144 tokens |
| DeepSeek V4 Flash 0423 | $0.18 | $0.82 | $3.09 | 1,048,576 tokens |
| DeepSeek V4 Flash 0731 | $0.11 | $0.42 | $1.60 | 1,048,576 tokens |
Our calculation from OpenRouter list prices. RAG means retrieval-augmented generation: a model answers using public sources or database results.
M3.1 Flash is cheaper than MiniMax M2.5 under each profile in the table, but it is not the least expensive listed option. DeepSeek V4 Flash 0731 costs $1.60 per 1,000 agent steps under these assumptions, compared with $5.70 for M3.1 Flash. OpenRouter lists the prices used for both calculations.
Its distinctive trade-off is the context limit. M3.1 Flash and both DeepSeek entries list 1,048,576 tokens, while Seed 1.6 Flash lists 262,144 tokens. A larger context limit can help with long documents or extended task histories, but it does not guarantee better answers or lower total application cost. OpenRouter provides the context figures.
What could we not verify?
MiniMax has not published a complete public account of the prompts, sampling settings, tool environments and error cases behind every launch benchmark. That leaves the company’s speed and agent-cost comparisons unresolved under independently matched conditions. The launch announcement gives the claims but not a full run log.
The public materials also do not provide a matched M3.1 Flash-versus-M2.7 benchmark table. The independent comparison establishes M3.1 Flash’s position against several current rivals, but it cannot settle the specific M2.7 question without equivalent tests and settings. Artificial Analysis provides the M3.1 profile.
The 93% AA-Omniscience figure is clear as a metric distinction, but the public launch material does not reproduce the full underlying dataset or error breakdown. That leaves open how often the model refused, answered partially or failed in particular factual categories. Artificial Analysis lists the metric structure, while MiniMax’s announcement does not discuss it.
The next useful evidence would be a reproducible comparison using the same model snapshots, prompts, reasoning settings and tool environments. Until then, M3.1 Flash’s strongest case is measurable performance on checked agent workflows, not unsupervised factual authority.
Sources

