

FuturPulse analysis · 5 October 2026
On 5 October 2026, Scale’s leaderboard puts GPT-6 Astra at 60.60 on Humanity’s Last Exam Diamond, while Artificial Analysis gives Claude Opus 5.5 an intelligence index of 58: no single LLM benchmark leaderboard identifies the best model.
At a glance
- Artificial Analysis compares more than 250 models across intelligence, task cost, speed, latency and context limits.
- Vellum lists Claude Opus 5.5 at 67.7% on Humanity’s Last Exam, but lists a different model at the top of several specialist categories.
- LiveBench uses 18 tasks across six categories, showing why a composite score should be opened before it is trusted.
- HyperBrowseComp contains 423 human-validated questions in 13 languages, a reminder that web browsing is a separate capability from ordinary chat.
- EnterpriseRAG-Bench uses more than 500,000 internal-style documents and 500 questions, which is closer to a company search problem than a general knowledge quiz.
What does an LLM leaderboard show?
An LLM leaderboard shows results under a defined test setup. It does not show a model’s universal ability, nor does it promise the same outcome in an application. A score is the result of a model version, prompt, tool access, time limit, evaluator and task set.
Start by identifying the unit being ranked. Arena ranks anonymous answers after users compare two models, so it measures preference in its supplied conversations. LiveBench instead publishes task-level results for reasoning, math, coding, language, data analysis and instruction following.
These are useful signals, but they answer different questions. A preference ranking can help choose a writing assistant. An objective test can reveal whether a model returned a verifiable answer. An agent benchmark can test a system that searches, runs code or edits files, rather than the base model alone.
The fast reading rule: never compare two scores until you have checked the task, the model version, the effort setting, the tools, the evaluation date and the measurement unit. If even one differs, treat the ranking as directional rather than a head-to-head result.
Which LLM rank tracker is the best?
No LLM rank tracker is best for every purchase. Artificial Analysis is useful when the decision includes cost, output speed and latency, while Arena is useful for public preference data and Vellum makes task-specific results easier to scan. The best tracker is the one whose task and operating conditions resemble yours.
Artificial Analysis lists Claude Opus 5.5 at 58 intelligence points, $5.98 median cost per task and 93 output tokens per second for its “max with fallback” setting. That is a rich buying signal, but it remains a specific configuration. A cheaper or lower-effort setting of the same family is a different product decision.
Vellum places GPT-5.6 Sol first on SWE-Bench at 96.2% and GPT-5.6 Sol first on BrowseComp at 92.2%, while it lists GLM-5.3-Flash first on AutoBench at 48.8%. The practical lesson is simple: a “best overall” label should not overrule the leaderboard for the work you actually need done.
Use trackers as a screening layer. They can narrow a field from hundreds of choices to three or four. The final selection should come from a small test on your prompts, files, policies and response-time limit.
How should you compare models across leaderboards?
Compare like with like: the same task type, the same model mode and the same measure. Do not place a human-preference rating beside a coding pass rate and call the higher number better. Percentages, index scores and pairwise ratings have different meanings.
Look particularly closely at agent results. The FLINT financial Text-to-SQL paper says general-purpose systems fall below 50% on production financial schemas, despite strong academic benchmark results. Text-to-SQL means turning a plain-language request into a database query. The gap arose where opaque identifiers and many table joins shaped the real task.
That is why a leaderboard winner can still fail a company workflow. The model may understand the question but lack the retrieval layer, tools, permissions, domain vocabulary or error checks required to complete the job. A production system also includes the harness: the software around the model that supplies context and runs actions.
EnterpriseRAG-Bench separates basic retrieval from conflicting-information, completeness and “information not found” questions. That design matters because a system that gives a fluent answer when no answer exists is not behaving safely, even if it performs well on easy retrieval.
Why can a top model be poor value?
A leading score can cost more, take longer or require a higher reasoning setting. Tokens are the chunks of text a model reads and bills by. For a high-volume support product, a modest quality gain may not justify a much slower response or a larger bill.
OUR CALCULATION: The table divides Artificial Analysis’s listed median task cost by its intelligence index for five leading configurations. It is not a benchmark and not a forecast of an API invoice. It is a simple snapshot of cost per listed point, using the tracker’s current task-cost and intelligence figures.
| Model configuration | Intelligence index | Median cost per task | Output speed | Our cost per index point |
|---|---|---|---|---|
| Claude Opus 5.5, max with fallback | 58 | $5.98 | 93 tokens/s | $0.103 |
| Claude Sonnet 5.5, max with fallback | 56 | $7.67 | 139 tokens/s | $0.137 |
| Claude Opus 5.5, xhigh with fallback | 56 | $3.46 | 79 tokens/s | $0.062 |
| GPT-6 Astra, max | 53 | $3.26 | 54 tokens/s | $0.062 |
| Claude Sonnet 5.5, xhigh with fallback | 52 | $2.75 | 105 tokens/s | $0.053 |
Source: Artificial Analysis model leaderboard. Cost-per-point column is FuturPulse arithmetic.
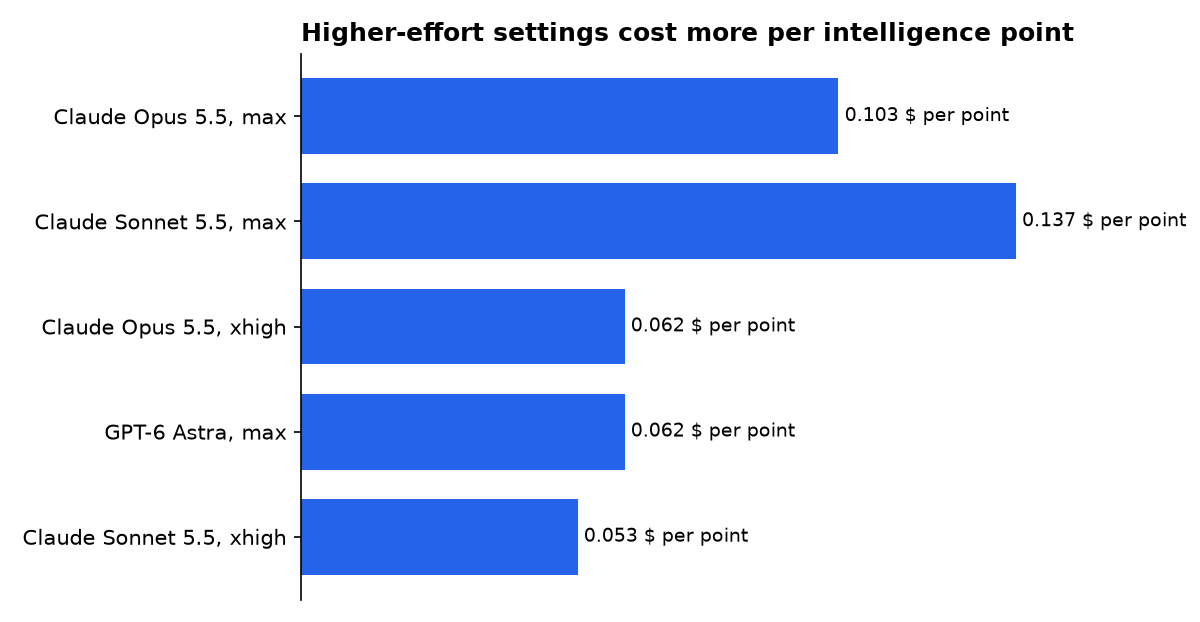
The calculation does not crown a winner. It exposes the question a headline rank leaves unanswered: how much are you paying for the last few points Buyers should also inspect latency, the delay before the first answer arrives, because a quick stream of text can still begin too late for an interactive product.
Does the score measure your task?
Often, only partly. A broad exam can test reasoning breadth, but it does not prove performance on browsing, multilingual research, desktop control or company knowledge. A specialist benchmark should change the shortlist when the specialist task matches your product.
HyperBrowseComp was released on 2 October 2026 with 423 manually authored and human-validated questions across 13 languages. Its questions require finding obscure evidence through web pages, videos, scanned documents, images or maps. That makes it more relevant to a research agent than a pure chat ranking.
There is another trap: model behaviour can reflect source labels as well as the substance of a result. A study of 12 agent models found preferred sources could outweigh one missing requirement about two-thirds of the time in its test design. That finding does not prove every leaderboard is biased. It does show why a buyer should inspect real outputs and sources, not only a final score.
For scientific or specialist reasoning, ask whether the test represents the work. A protein-folding post-training study reported a 3.23 percentage-point macro-average gain across 10 reasoning benchmarks. That is evidence about those evaluated tasks, not proof that the same technique improves your contracts, customer tickets or database queries.
Timeline: what was promised versus what shipped
The useful history of an LLM leaderboard is not its marketing label. It is the dated record of its stated scope, released materials and remaining limits. These entries show why buyers should check release notes before treating a rank as current.
-
LiveBench’s stated promise: a current release with fresh, objective evaluation. What shipped: the project says its current release is dated 25 April 2025, but says not all questions from that release are public and directs full public evaluation to the 25 November 2024 set. The repository records both dates and the limitation. -
Arena’s stated promise: open leaderboard methodology. What shipped: Arena published Arena-Rank, an open-source package using Bradley-Terry ranking and confidence intervals. The page says it was last updated on 21 February 2026. Arena’s methodology post gives the dates and implementation details. -
A research claim: structural protein data can improve broader reasoning. What shipped: the preprint reported gains on all 10 of its evaluated benchmarks, but it did not establish a general production advantage outside those tasks. The paper defines the measured scope. -
HyperBrowseComp’s stated role: a hard test for multilingual, multimodal web research. What shipped: version 1 of the paper described 423 questions, 13 languages and a common agent protocol, rather than a general chat leaderboard. The release clarifies what its scores are designed to mean. -
FLINT’s production claim: a domain system can close gaps left by academic Text-to-SQL tests. What shipped: its authors described a deployed financial retrieval service and two datasets totaling 359 questions. The paper makes clear that system design, not only the chosen LLM, produced the reported result.
How should a team build a reliable shortlist?
Build a shortlist from separate leaderboards, then run one controlled comparison. Choose one general ranking for breadth, one task-specific test for the work, and one operating view for price and speed. This avoids rewarding a model three times for the same kind of capability.
- Write the job in one sentence. “Answer support questions from approved documents” is different from “browse the web and compare current products.”
- Choose failure conditions first. Include wrong citations, invented facts, missing records, unsafe actions and unacceptable delay.
- Lock the setup. Record the exact model identifier, provider, reasoning mode, system prompt, retrieval method and tool permissions.
- Use representative work. Include easy requests, routine requests and the cases that caused real operational problems.
- Price the whole run. Count retries, long inputs, tool calls and human review, not only listed input-token prices.
Use a small scorecard rather than a grand total. Mark each model pass, conditional pass or fail for accuracy, refusal handling, citation quality, speed and cost. A model that loses a public ranking but passes your difficult cases is the better business choice.
For agents, test the surrounding system too. EnterpriseRAG-Bench’s categories include conflicting information, completeness and missing information, three areas where a model’s polished prose can hide a retrieval failure. Your acceptance test should require the system to admit uncertainty when the evidence is missing.
What we could not verify?
No public leaderboard can disclose every production condition. Current rankings do not establish the prompts, proprietary context, provider routing, safety settings, rate limits, discounts or human review rules used in every buyer’s deployment. The model provider and the organization operating the application could settle those terms.
Public scores also cannot prove that a model’s behaviour will remain unchanged after a silent service update. Vendors could settle that question by publishing version pinning, evaluation configurations and dated change logs. Buyers can settle it locally by retaining a fixed evaluation set and re-running it when a model or provider changes.
Sources
- Scale Labs leaderboard
- Artificial Analysis model leaderboard
- Vellum LLM leaderboard
- LiveBench repository and evaluation notes
- Arena: How It Works
- Arena-Rank methodology
- HyperBrowseComp
- Source Preference in the Wild
- From Benchmarks to Production: FLINT
- EnterpriseRAG-Bench
- Does Learning Protein Folding Generalize to Broader Reasoning

